1) DMGP framework for target prediction
To implement the target prediction function for small molecular compounds, we constructed a Double Molecular Graph Perception (DMGP) framework using TrimNet and DMPNN, which combines the predictive results of the two algorithms to rank the probable targets of the query molecule. Firstly, we designed a multi-task binary classification model using TrimNet to learn the effect of a compound on multiple targets (positive or negative ligand compound). TrimNet is a graph-based approach with few parameters and high prediction accuracy recently proposed by our research group, which adopts a novel triplet message mechanism to effectively learn molecular representations. When a molecule is input, the output form of TrimNet is a 640-dimensional 0~1 probability vector  corresponding to 640 targets, and each dimension vector represents the probability of the query molecule to become a positive molecule for the corresponding target. DMPNN model, as another branch of the DMGP framework, was used to estimate the high dimensional similarity of the query molecule to 640 target positive molecules. When a molecule is input, the output form of DMPNN is also a 640-dimensional 0~1 probability vector
  , and the sum of each element in the vector is 1. Finally, by elementwise multiplication of vector and , we obtained a 640-dimensional 0~1 relevance score vector
  , and the 640 elements in the vector represent the final relevance scores of the query molecule to the 640 targets, respectively. When the relevance score corresponding to a target is greater, the target is more probably to be the target of the query molecule, and the workflow of DMGP framework is shown in Figure 1.
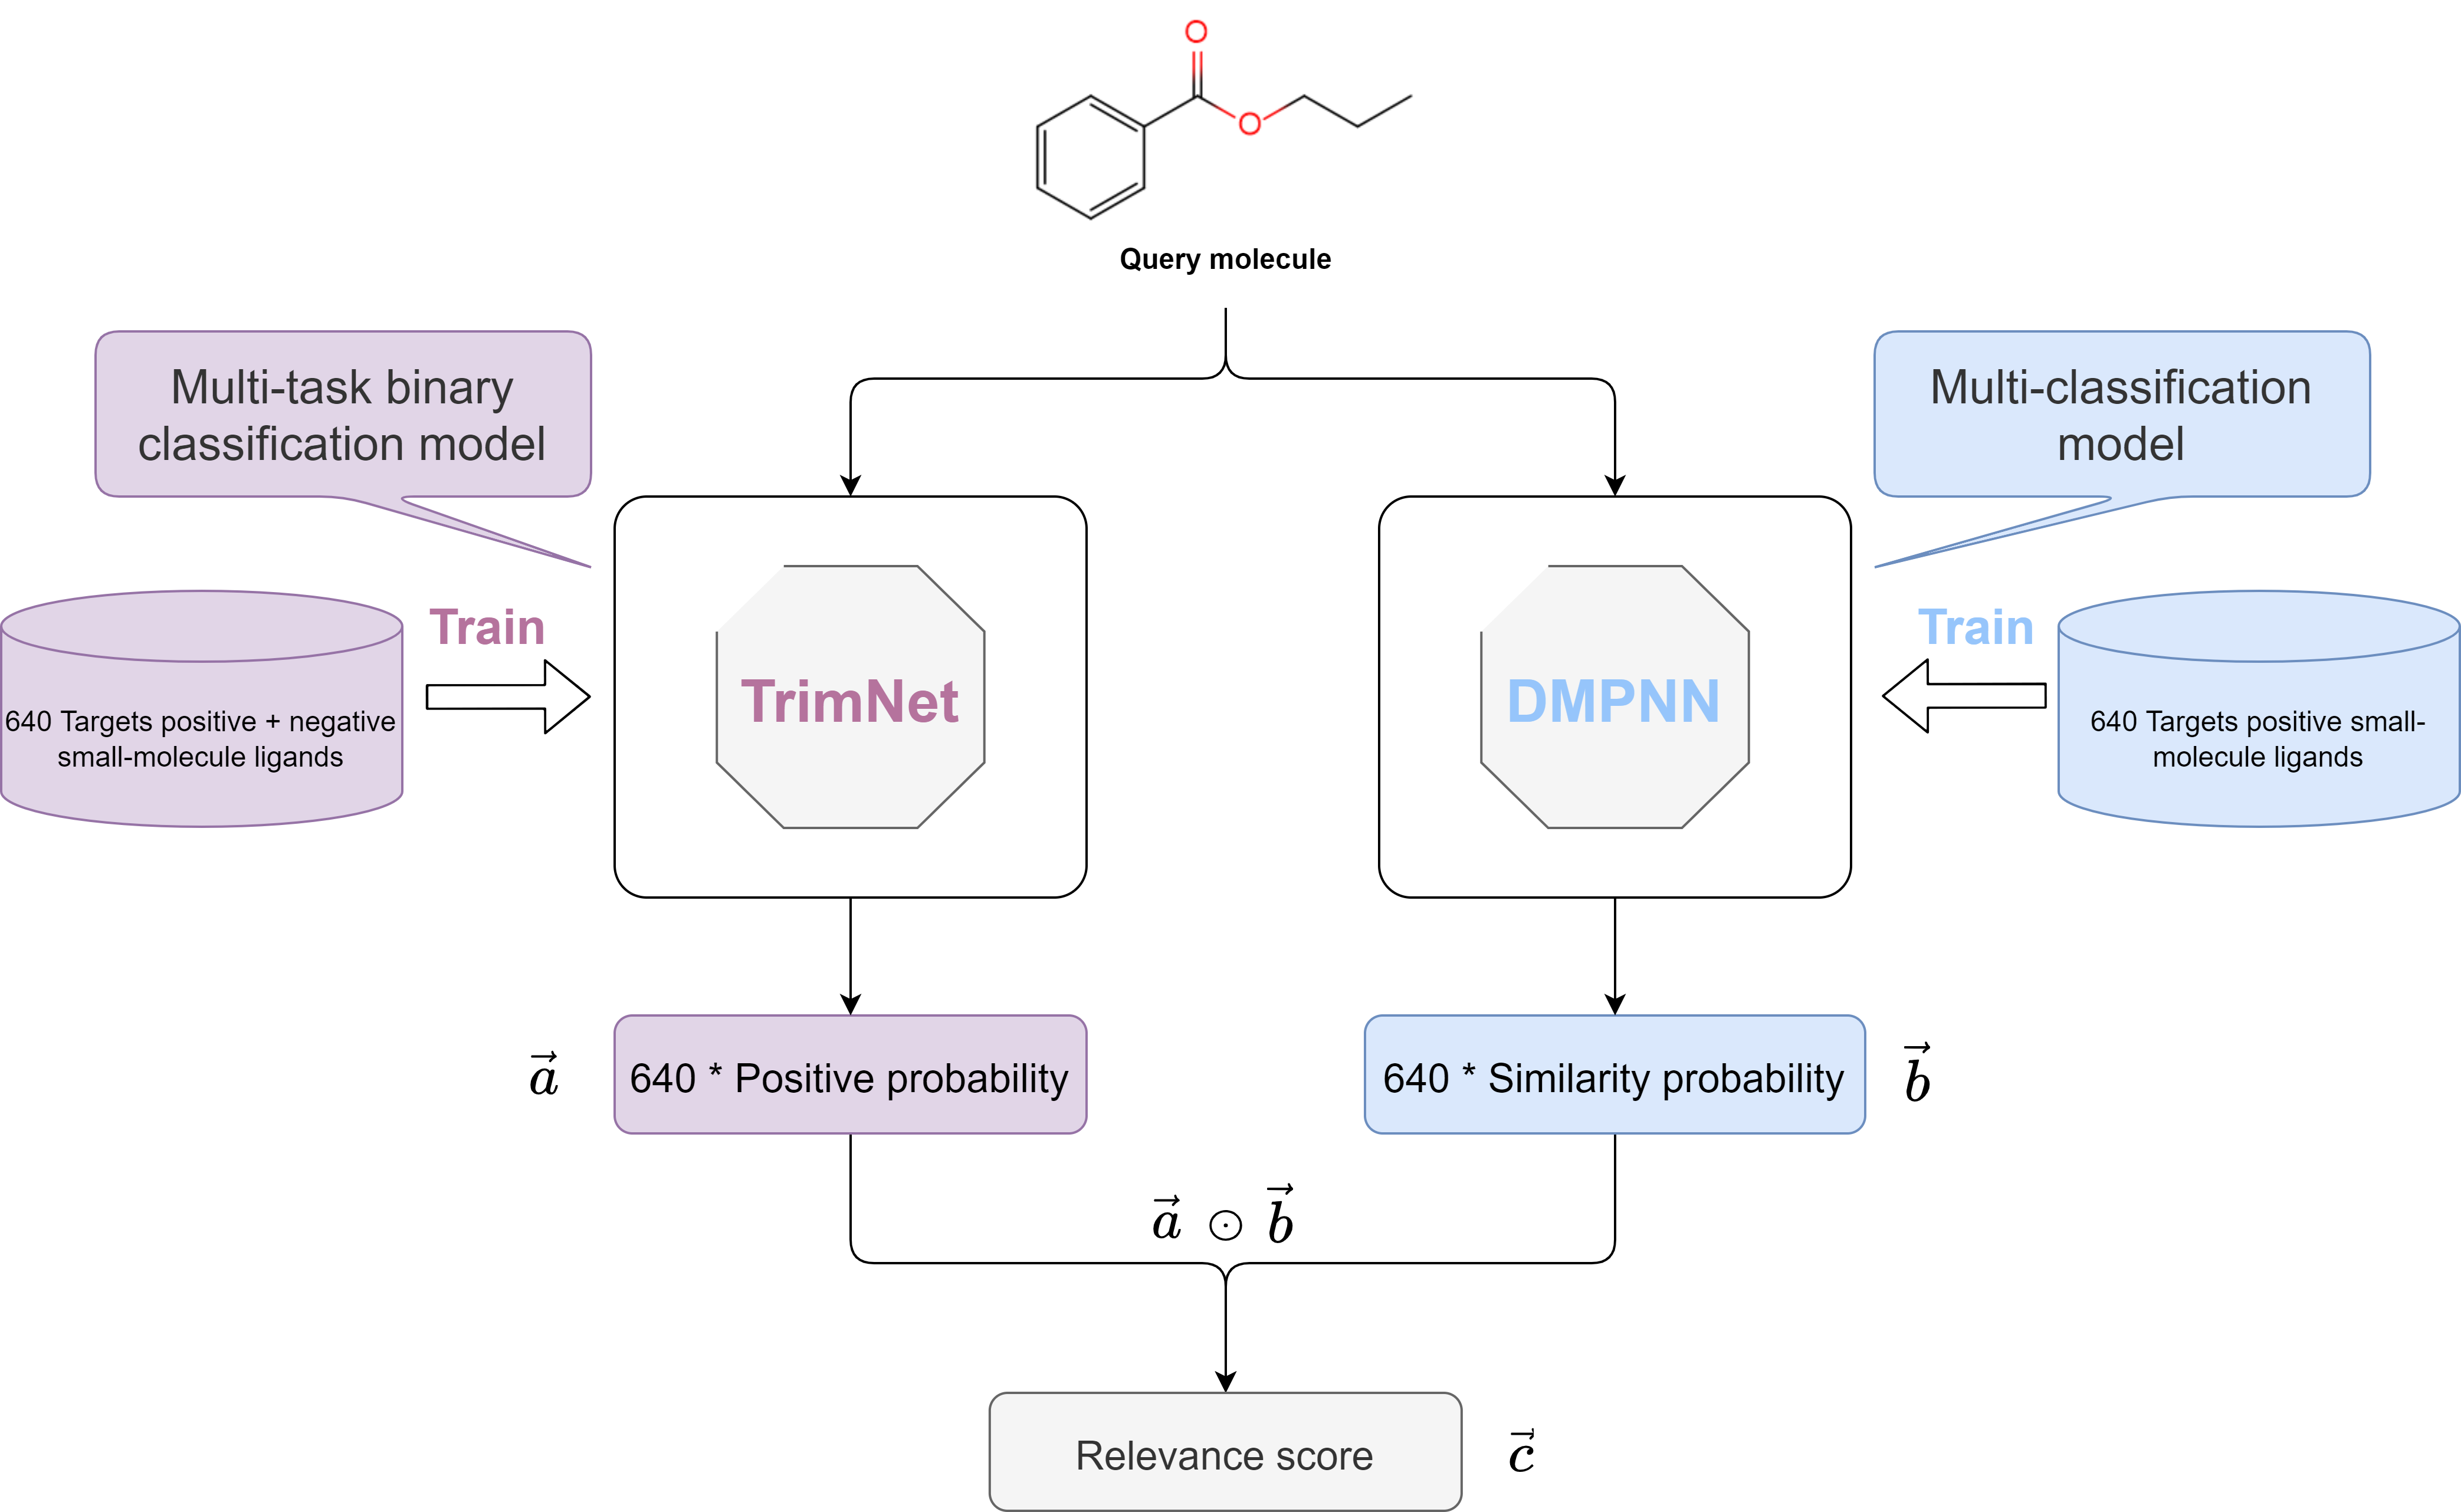
Figure 1. Workflow of DMGP framework for target prediction
2) MSAP framework for bioactivity prediction
To implement the bioactivity prediction function for small molecular compounds, we developed a Multi-model Self-validation Activity Prediction (MSAP) framework consisting of 7 ML regression models, including 4 graph-based deep learning models, Message Passing Neural Network (MPNN), Directed Message Passing Neural Network (DMPNN), Graph Attention Network (GAT), Graph Isomorphism Network (GIN) and 3 traditional ML models based on molecular fingerprinting, namely Support Vector Machine (SVM), Random Forest (RF), and eXtreme Gradient Boosting (XGBoost). We randomly divided the structure-activity dataset of small-molecule inhibitors of each target into training, validation and testing sets in the ratio of 8:1:1 by stratified sampling of the activity data, and trained, validated and tested the MSAP framework. For each query molecule, after selecting a target of interest, we provide it with two prediction modes, namely Best-mode and Merge-mode. Based on the performance of MSAP framework on the test set, the Best-mode is to select the best performing model to predict the pIC50 value of the query molecule, while the Merge-mode selects several models in the framework whose performance meets the established criteria to predict the pIC50 value of query molecule at the same time. And after excluding abnormal predicted values, take the average of the predicted values of multiple models as the final predicted pIC50 value of the query molecule in Merge-mode. The workflow of small molecules bioactivity prediction is shown in Figure 2.
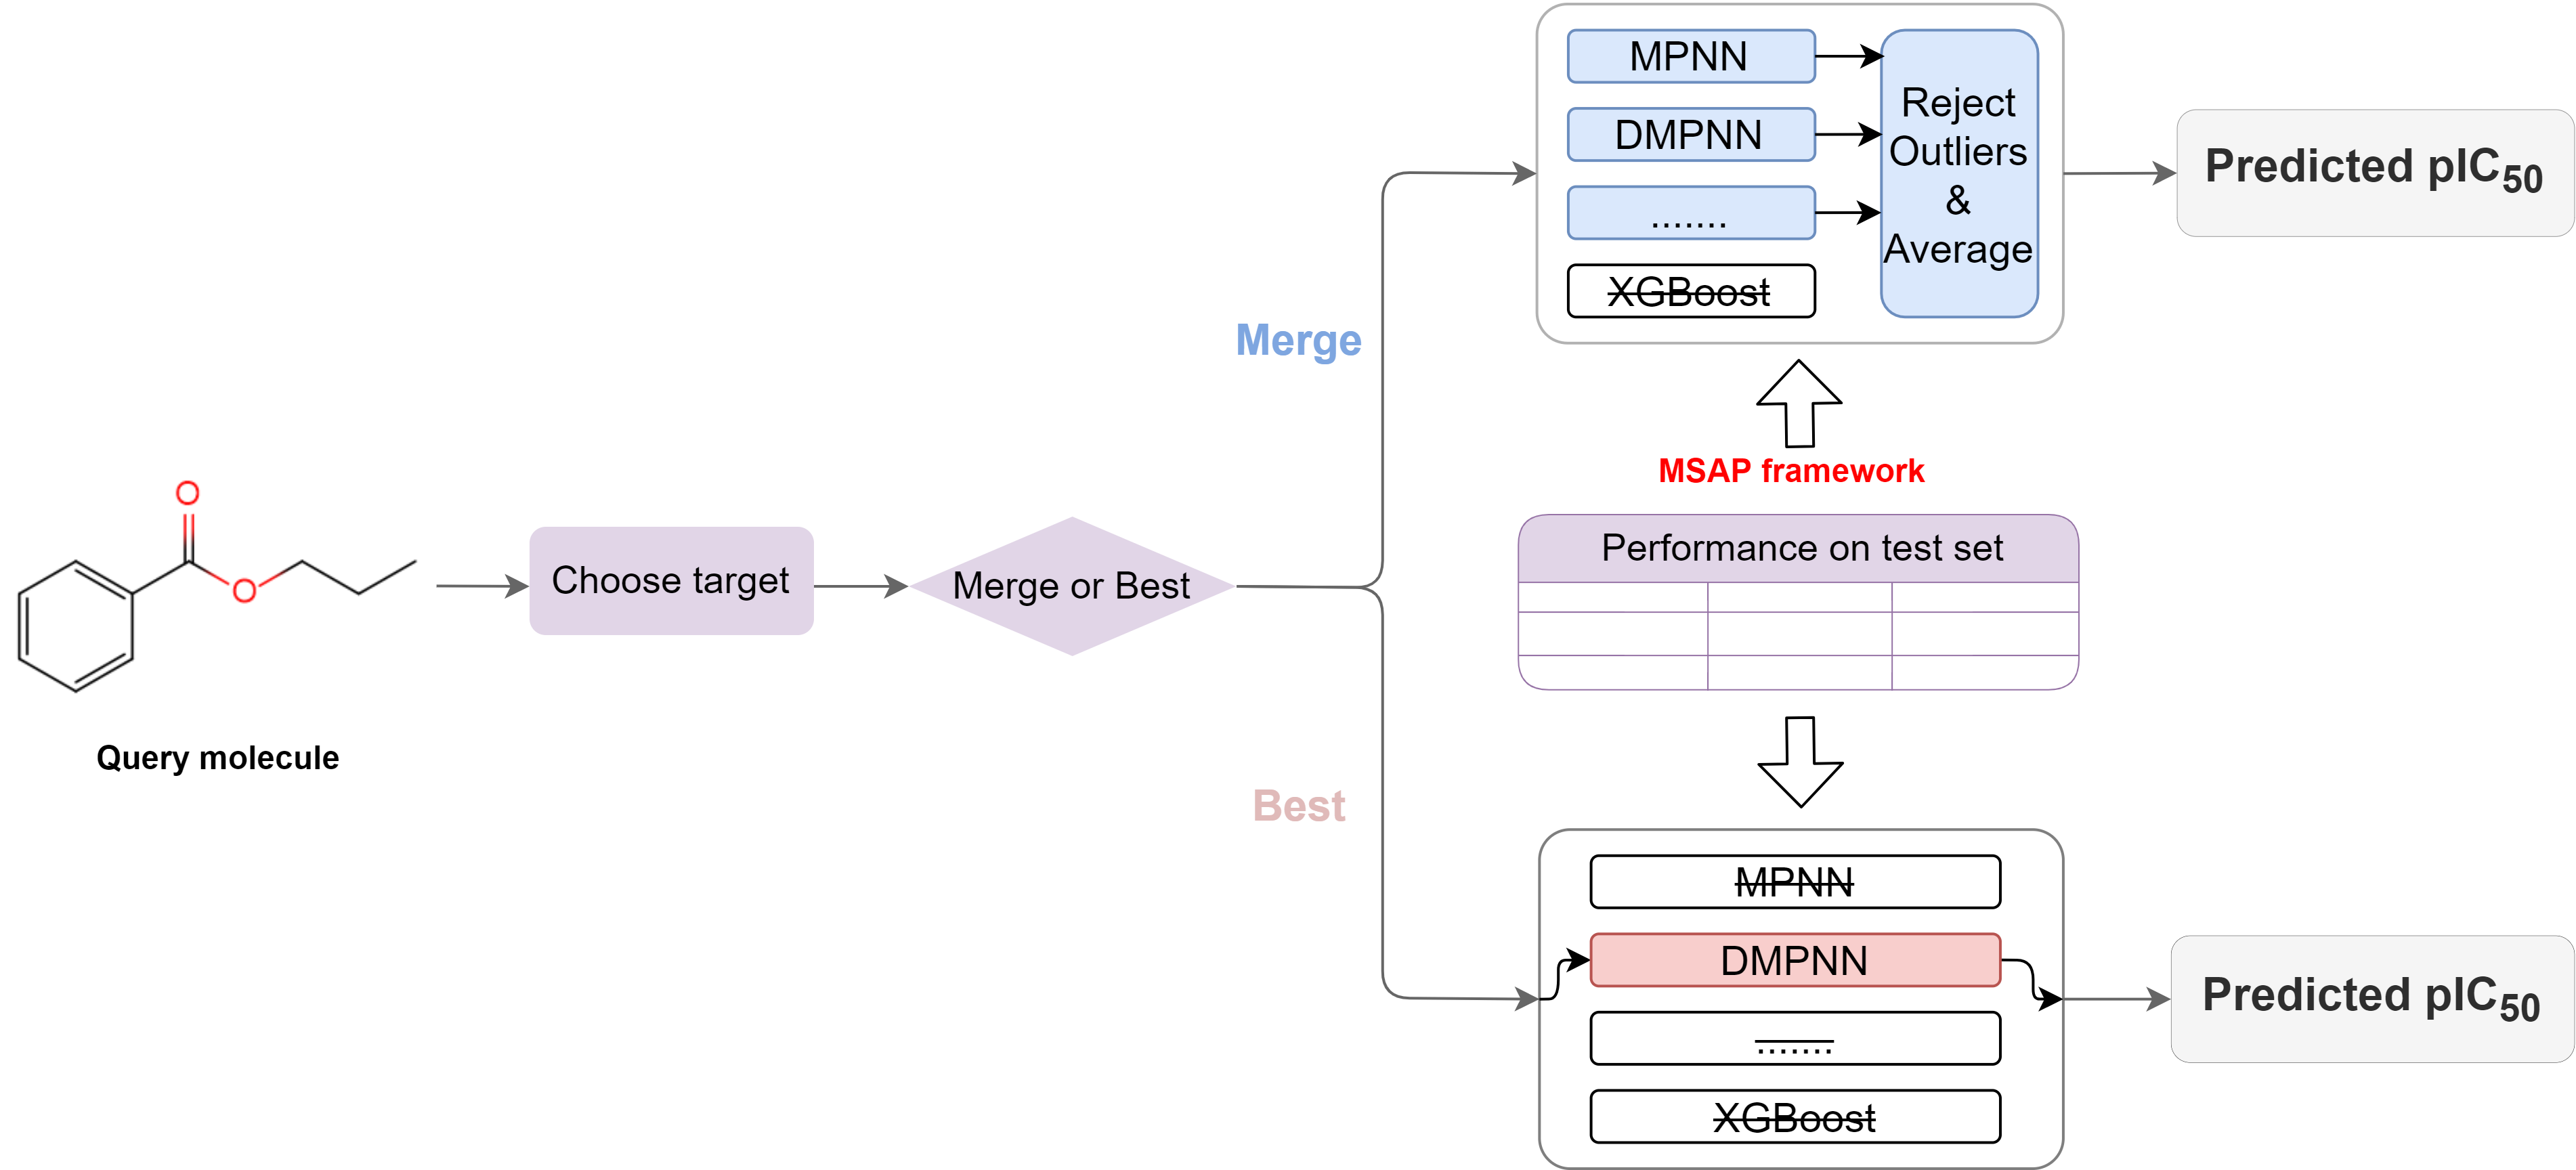
Figure 2. Workflow of bioactivity prediction
3) Model for ADMET prediction
For ADME-related endpoints, many open-source reliable and high-performing computational methods have been developed. Among them, Therapeutics Data Commons (TDC) developed by Huang et al. integrates several machine learning datasets and tasks related to drug development, contributing to accelerating the development, validation, and transition of machine learning models to clinical implementation. In order to achieve accurate and fast prediction of ADME-related properties of compounds, we used the molecular characterization approach in TDC and suitable machine learning models to model the ADME-related datasets and obtained models with good predictive performance. The models used on the ADME-related datasets and the validation methods are shown in Table 1. In addition, since our previously developed TrimNet has comparable performance with state-of-the-art models for toxicity prediction, we used TrimNet for modeling the toxicity-related dataset.
Table 1. Information about the model used for the ADMET endpoint dataset
| Dataset |
Model |
Validation |
Reference |
| Log D7.4 |
ContextPred |
5-fold cv. |
ArXiv preprint arXiv:2102.09548, 2021. |
| Log S |
AttentiveFP |
| HIA |
AttrMasking |
| Pgp inhibitor |
AttrMasking |
| BBB Penetration |
ContextPred |
| CYP2C9 inhibitor |
ContextPred |
| CYP2D6 inhibitor |
ContextPred |
| CYP3A4 inhibitor |
ContextPred |
| CYP2C19 inhibitor |
ContextPred |
| CYP1A2 inhibitor |
ContextPred |
| CYP2D6 substrate |
ContextPred |
| CYP3A4 substrate |
CNN |
| T1/2 |
AttrMasking |
| Tox21 |
TrimNet |
Train/validation early stopping |
Briefings in Bioinformatics, 2021, 22(4): bbaa266. |